In 2025, we observed a failure of seasonal upwelling in the Gulf of panama.
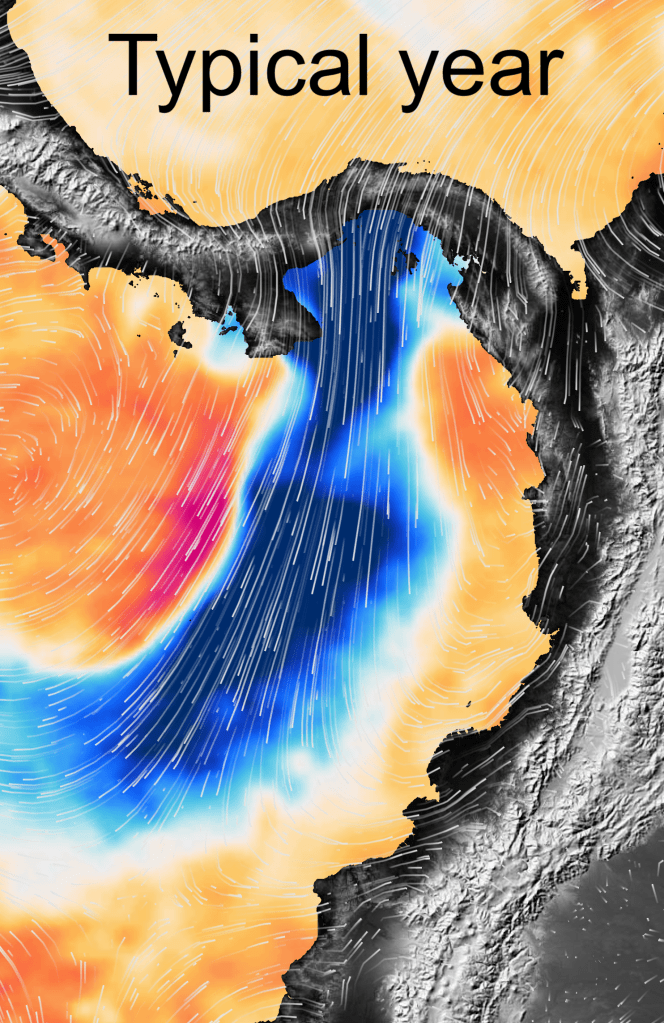
Typically (left), wind jets form across the Isthmus of Panama between Jan-March as the ITCZ migrates south.
These wind jets push surface waters in the Gulf of Panama south which are then replaced by deep, cold, nutrient-rich waters, supporting biodiversity and fisheries.
In 2025, the southerly winds were neither strong enough nor did they blow for sufficiently long enough for the upwelling to kick-start.
We published our observations in this paper: https://www.pnas.org/doi/10.1073/pnas.2512056122
the 2026 upwelling season
We are closely tracking the upwelling in collaboration with STRI’s Marine Monitoring Program. Will upwelling fail again in 2026 or will it return to more normal conditions?
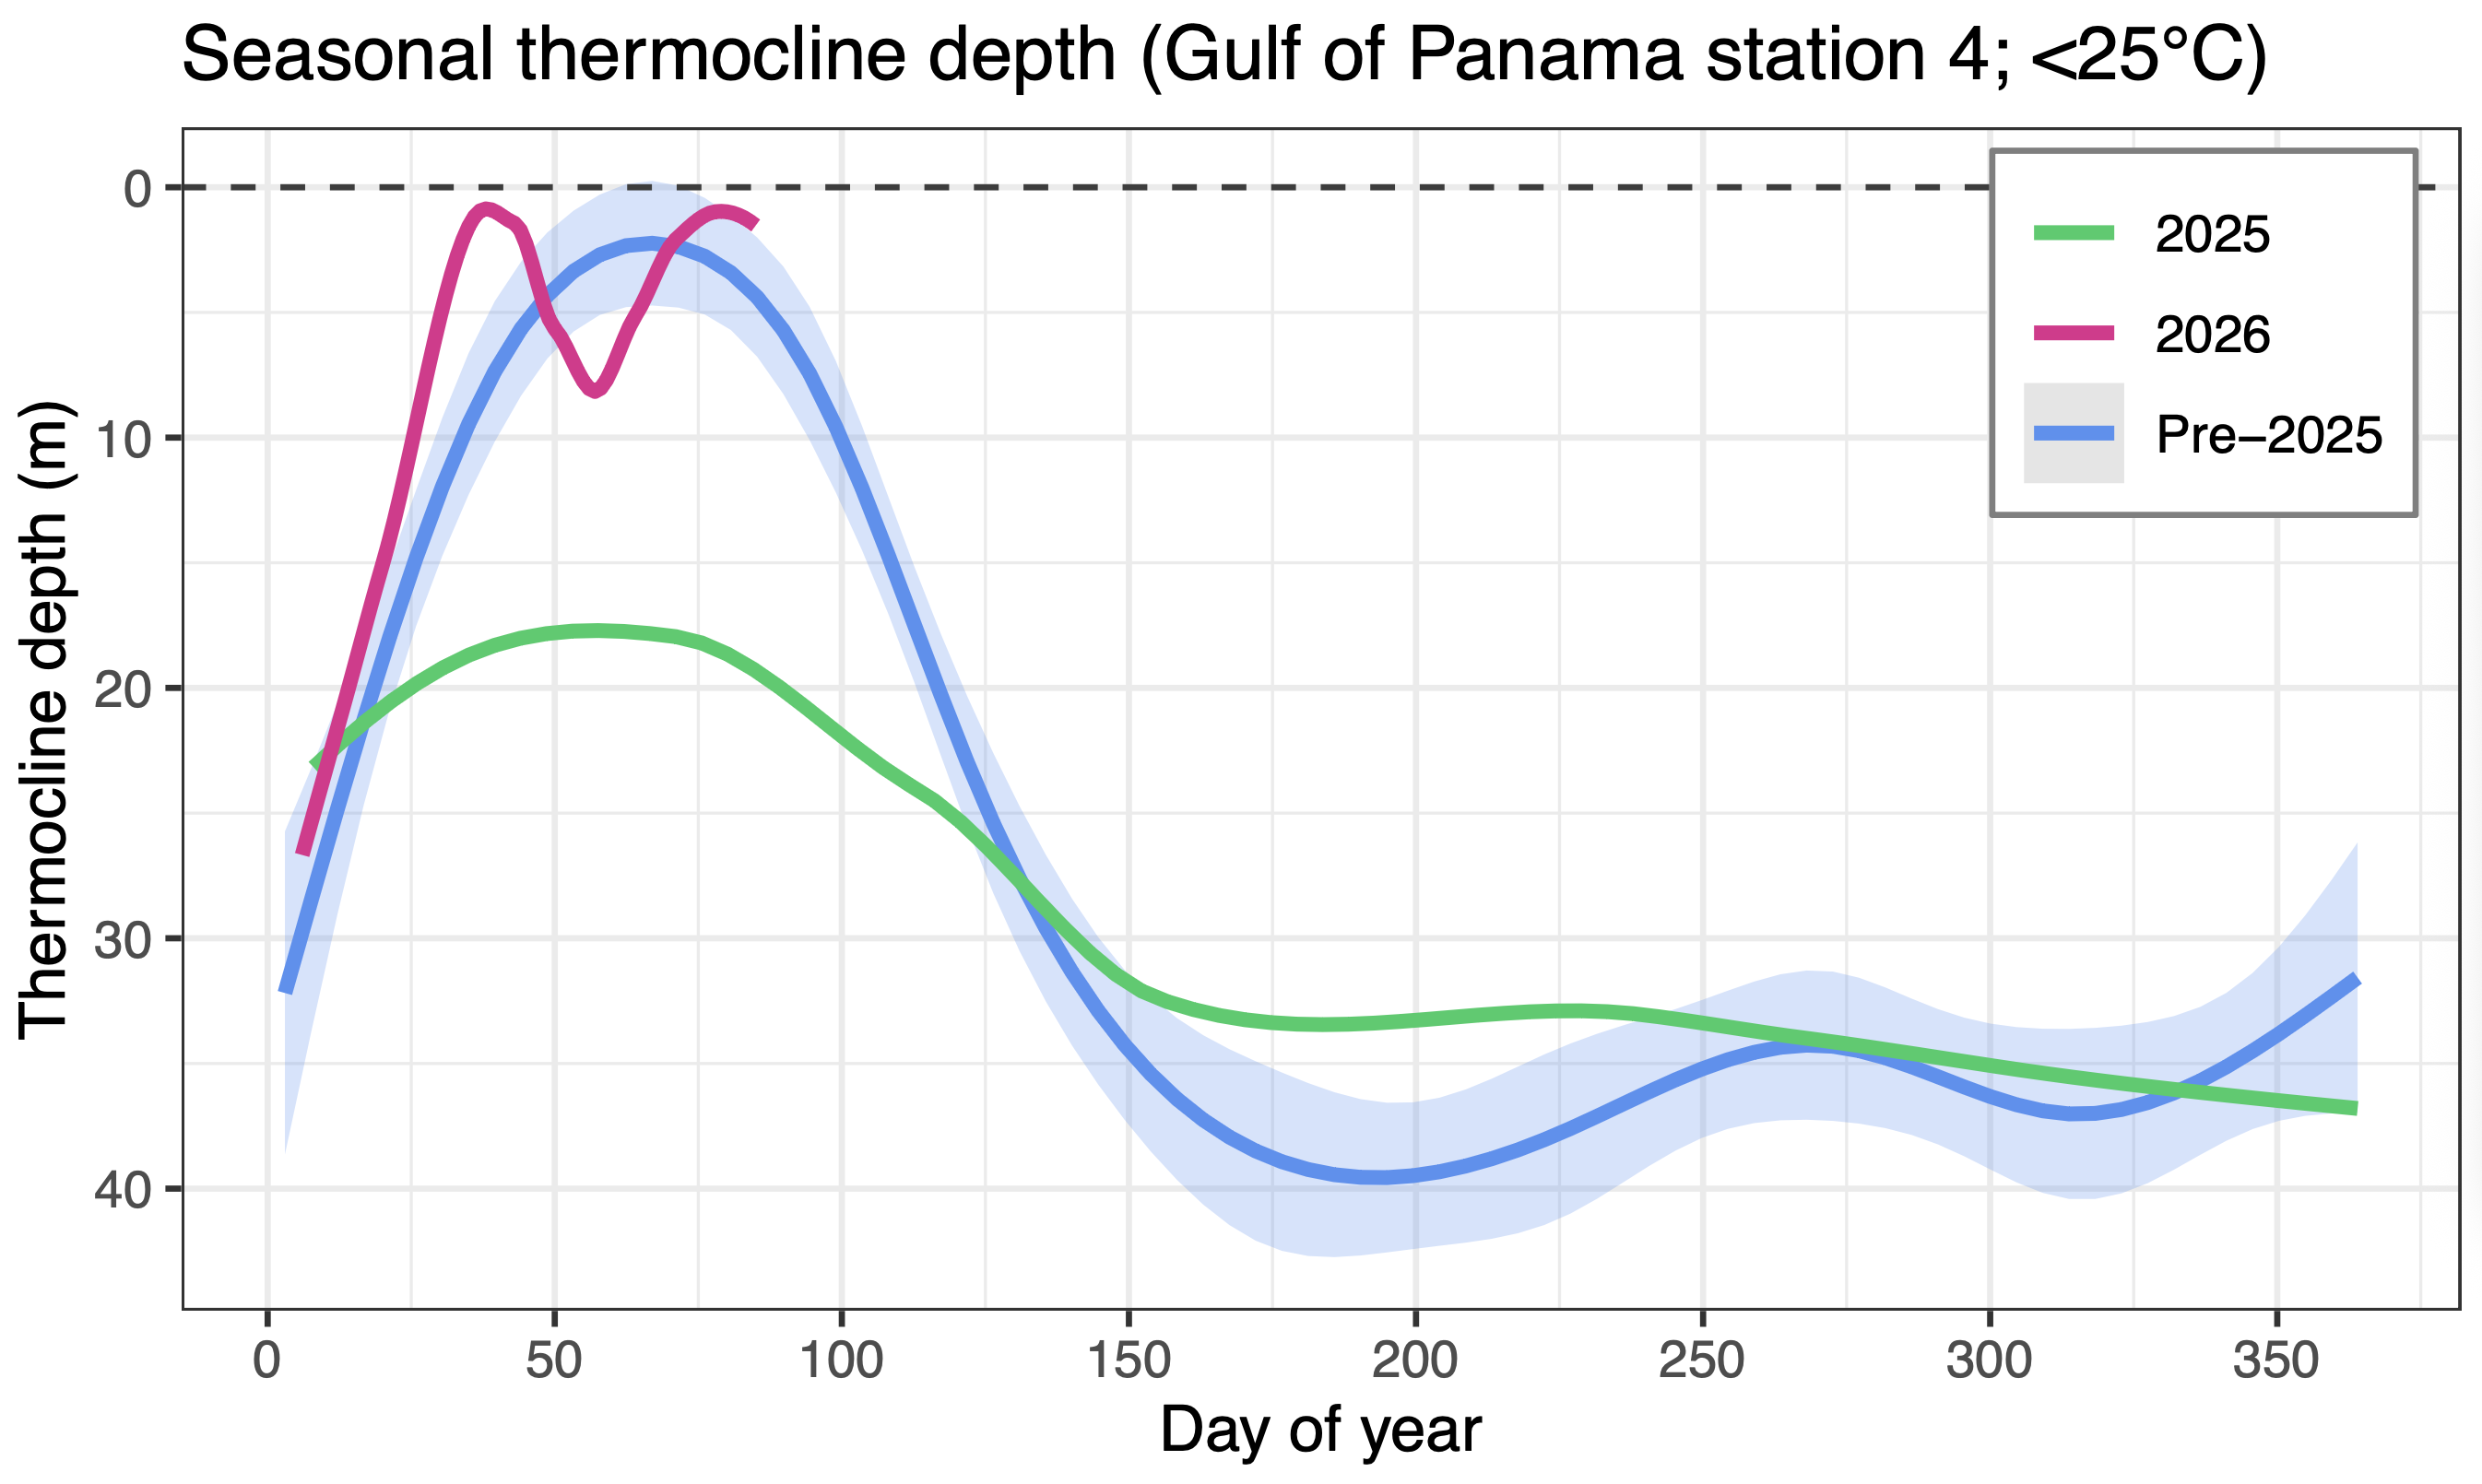
We will update in the graph below how the thermocline evolves through the year as directly-measured data comes in:
Update 27 Mar, 2026: The second wave of strong 2026 upwelling persists. Large red tides were observed within the Bay of Panama yesterday (26th March).
Update 13 Mar, 2026: The graph above now has enough data points in 2026 to allow us to smooth it in the same fashion as the 2025 data for a more accurate comparison. We find that strong upwelling persists into mid-March and the thermocline sits close to the surface. Winds remain variable.
Update 6 Mar, 2026: Upwelling in 2026 continues to surprise. Trade winds returned for a short period, and were apparently sufficiently strong las week to force the thermocline back up to the surface. We have seen these double (and even triple peaks) before, but how frequent they are remains to be tested. More next week.
Update 2 Mar, 2026: The intense upwelling of the last few weeks has collapsed very quickly as trade winds failed again. One possible reason is that the Bermuda high is weak and positioned further east than is needed to drive the pressure gradient that sets up wind-jet upwelling in the Gulf of Panama, although this idea needs further exploration
Update 20 Feb, 2026: Data in from yesterday, 19th February. The thermocline at Station 4 remains very close to the surface, and has even risen a little, and is now at 1.04m. Strong upwelling conditions persist.
Update 18 feb, 2026: On the 12 feb, the thermocline was observed to at 1.24m water depth in the Gulf of Panama. This is almost identical to the week previous (1.22m).
Update 5 feb, 2026: Upwelling has returned with a vengeance in 2026. The thermocline at Station 4 is now close to the surface and waters as low as 16 degrees C have been reported at the surface in some parts of the Gulf.
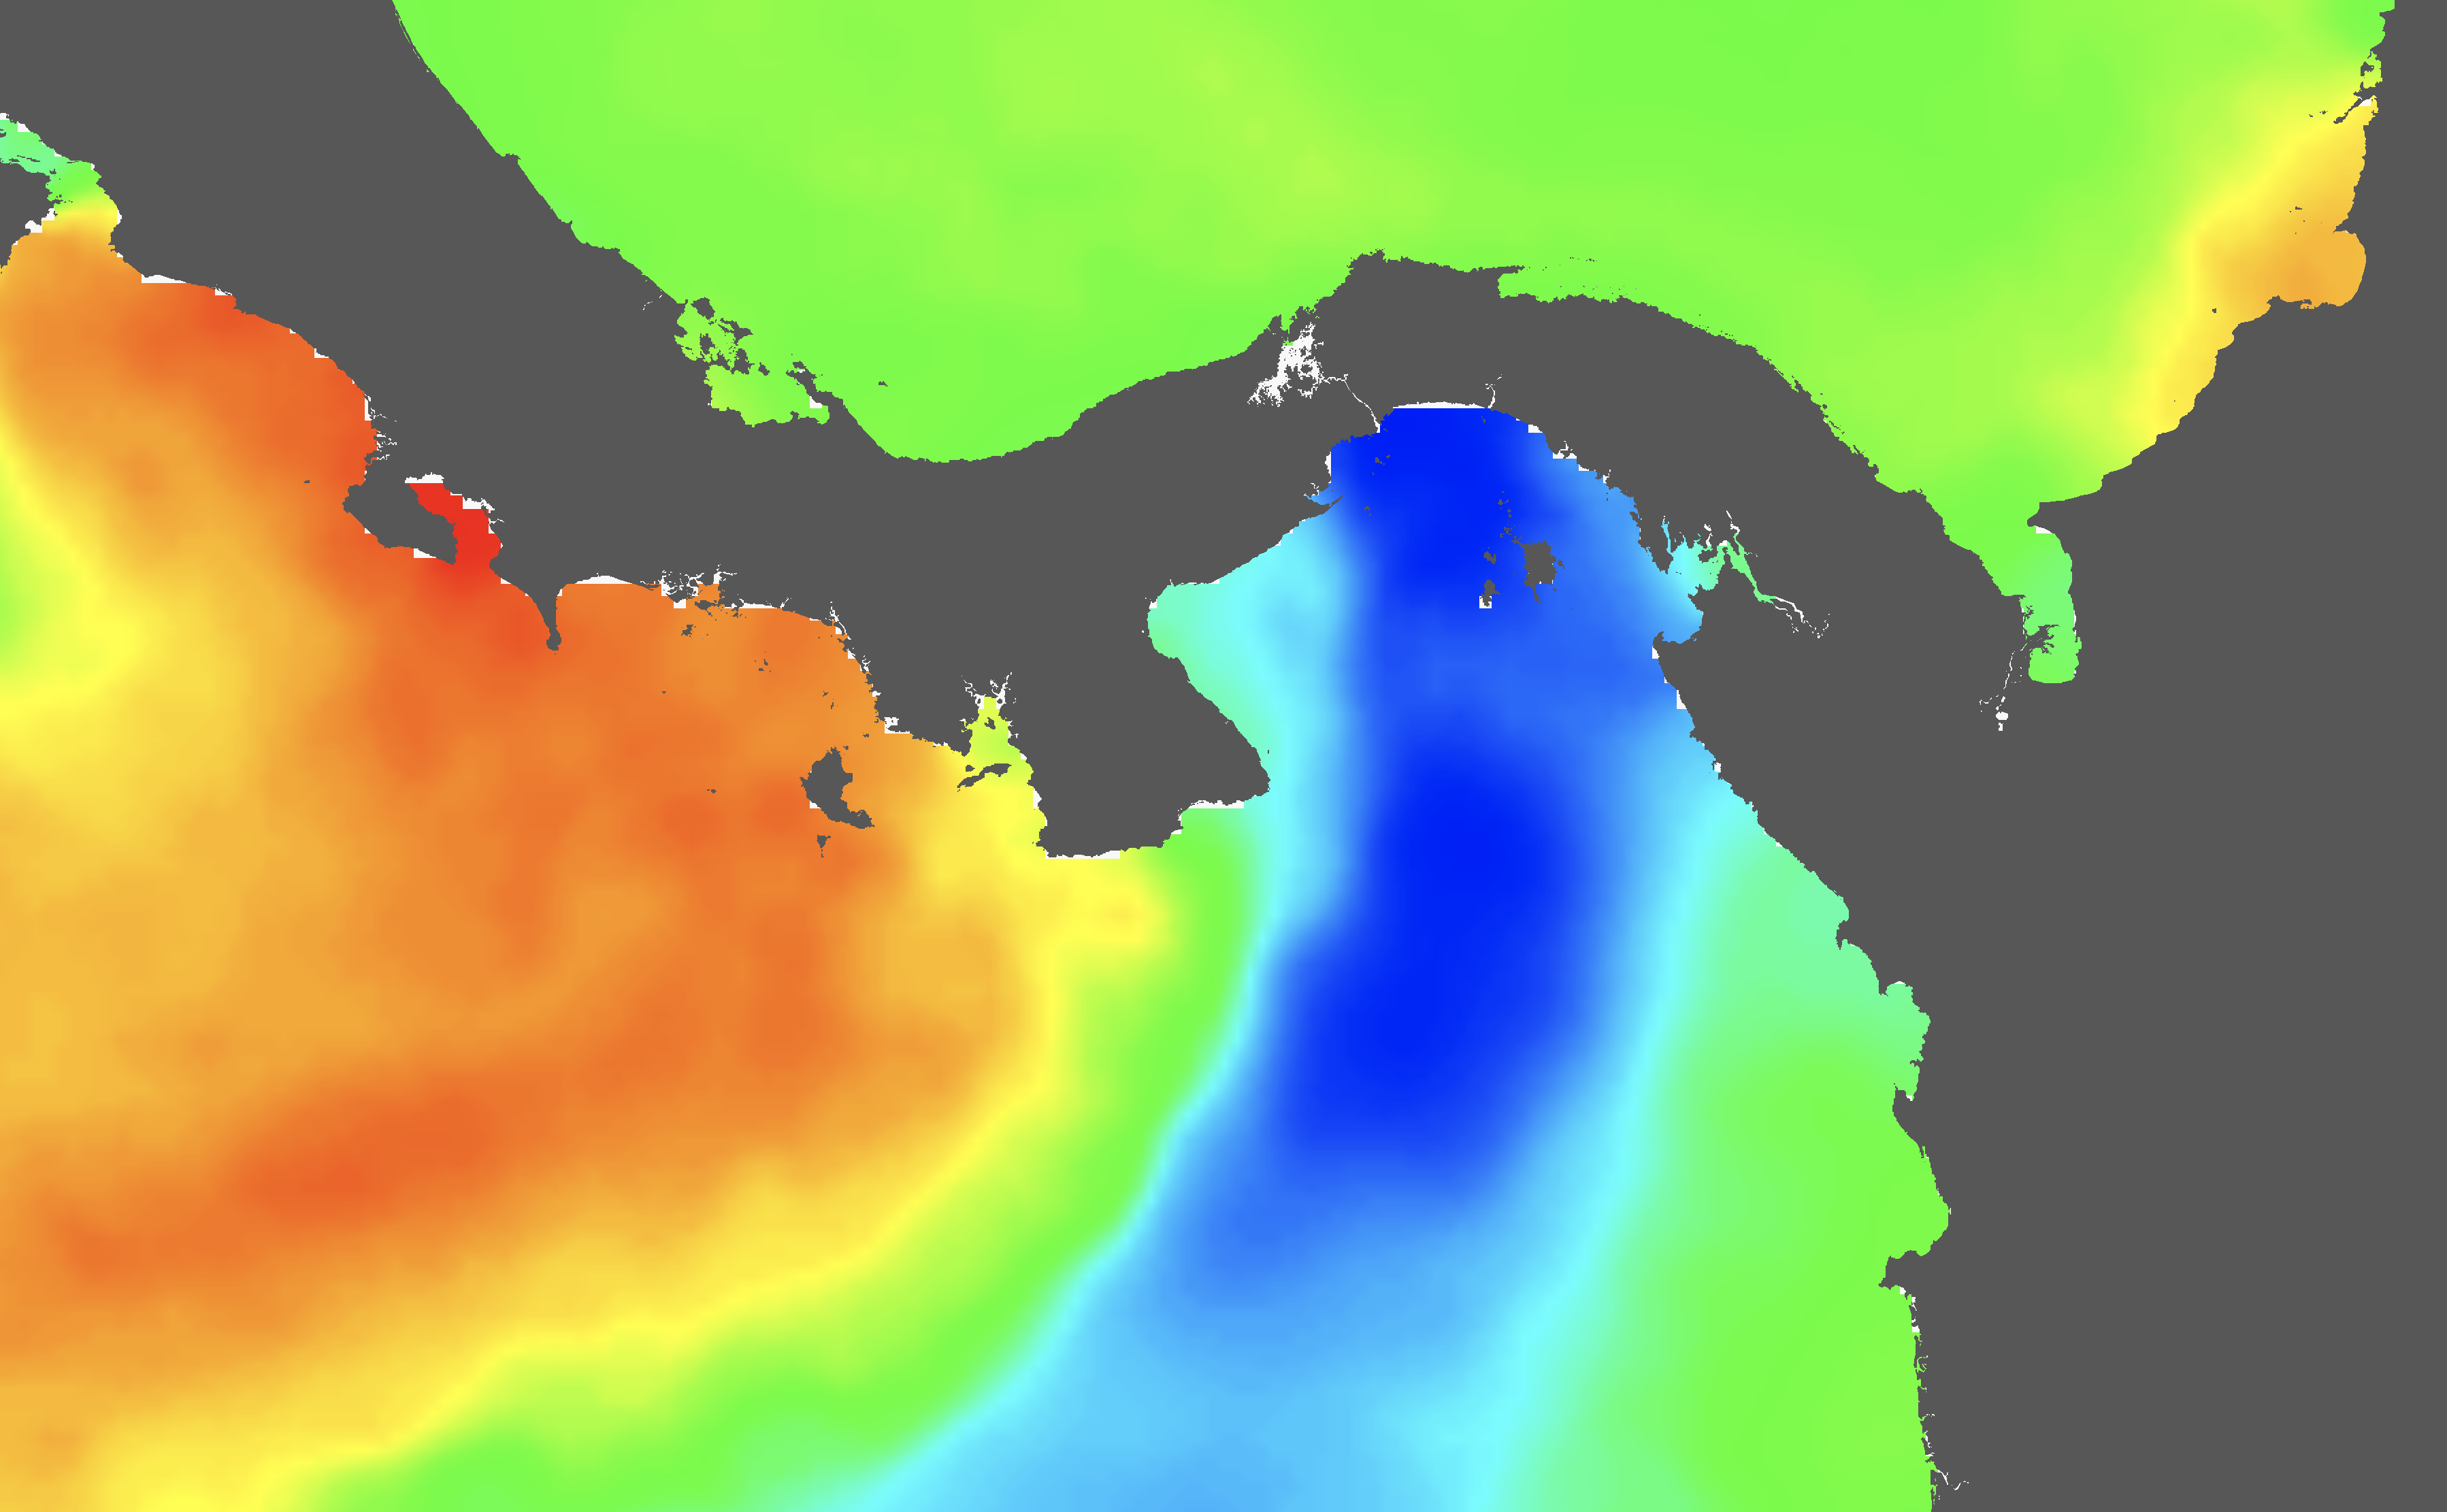
Sea surface temperatures on Saturday 7th February 2026 (MODIS) showing strong large plume of upwelled water extending from the Gulf of Panama
About thE DATA graph
The thermocline marks the boundary between warm surface waters and the cold, nutrient-rich waters below. We define it here as the shallowest depth where temperature drops below 25°C. During upwelling, strong winds push surface waters offshore, allowing deep waters to rise and bringing the thermocline closer to the surface.
The blue line shows the typical seasonal pattern based on weekly measurements from 2017-2024, with the shaded area representing 95% confidence interval. The coloured lines track how 2025 (green) and 2026 (pink) compare to this baseline. When the thermocline moves upwards close to the sea surface (0m, dashed line) it indicates upwelling.
Temperature profiles are directly measured by weekly CTD at Station 4 of STRI’s Bay Panama Monitoring stations (located: 8.736, -79.266). The baseline uses a generalised additive model (GAM) to smooth the seasonal pattern, whilst 2025 uses locally weighted regression (loess) to capture the year’s trajectory. For 2026, we connect the points directly until sufficient data accumulates for smoothing. Code available on request.
Data and more information on sampling available here: https://doi.org/10.60635/C35S59
Thanks to Andrew Sellers, Anabell Cornejo and all those who support the monitoring program.

You must be logged in to post a comment.